What's the Risk?

General TSP Discussion.

Moderator: Aitrus

User avatar
fordest
Posts: 605
Joined: Wed Sep 26, 2012 3:48 pm

Re: What's the Risk?

Post by fordest »

TopComm wrote:Did some tweaking for a little better 7σ with 16198 - Lowest return: 25.99


Oh nice work! I like this one.
100% in the daily system since August 2, 2017.
Following strategy (current pick) #88676. 2020 real life has been following #110838

Octjan2
Posts: 332
Joined: Thu Feb 25, 2016 8:01 pm

Re: What's the Risk?

Post by Octjan2 »

This may be the best one yet. However, there is a lot of time in F.

ksmoly04
Posts: 66
Joined: Thu Oct 06, 2016 2:08 pm

Re: What's the Risk?

Post by ksmoly04 »

Octjan2 wrote:This may be the best one yet. However, there is a lot of time in F.


Approximately 3 months total; I think that's something I could personally tolerate, and if the F-fund gets too dicey, there's always the G-Fund to swap into. For the limits that we're seeking, this is a rockstar strategy.
Daily Seasonal Since: August 23, 2017
Current Strategy: 16198 / 7.21σ

User avatar
onerepmax
Posts: 138
Joined: Tue Aug 08, 2017 9:29 am

Re: What's the Risk?

Post by onerepmax »

there are several great strategies with less than 2 months (15% time) in F

http://tspcalc.com/seasonal.php?ID=1619 ... =5&Fmax=15

HINT: Don't use 2017 in your sort yet. I think the incomplete yearly data skews it enough to miss out on some nice numbers.

I'll be transitioning to #16013 soon, either at the first of the year or next IFT (only 1 day difference)

User avatar
fordest
Posts: 605
Joined: Wed Sep 26, 2012 3:48 pm

Re: What's the Risk?

Post by fordest »

In case you missed it in the other thread, I found a sigma of 10.1!

16250

We need updated charts 12X12... :lol:

And I don't get the math but I love reading the explanations. What does that mean for likelihood of a negative return?
100% in the daily system since August 2, 2017.
Following strategy (current pick) #88676. 2020 real life has been following #110838

JoeMurphy
Posts: 10
Joined: Sat Apr 01, 2017 8:42 am

Re: What's the Risk?

Post by JoeMurphy »

onerepmax wrote:there are several great strategies with less than 2 months (15% time) in F

http://tspcalc.com/seasonal.php?ID=1619 ... =5&Fmax=15

HINT: Don't use 2017 in your sort yet. I think the incomplete yearly data skews it enough to miss out on some nice numbers.

I'll be transitioning to #16013 soon, either at the first of the year or next IFT (only 1 day difference)


Good observation.

shadogree
Posts: 25
Joined: Sat Sep 23, 2017 2:28 pm

Re: What's the Risk?

Post by shadogree »

fordest wrote:In case you missed it in the other thread, I found a sigma of 10.1!

16250

We need updated charts 12X12... :lol:

And I don't get the math but I love reading the explanations. What does that mean for likelihood of a negative return?


I can't decide, because you keep finding the ones I like. Stop it. :wink: Good find.

User avatar
12squared
Posts: 675
Joined: Thu Dec 31, 2015 7:28 am

Re: What's the Risk?

Post by 12squared »

fordest wrote:In case you missed it in the other thread, I found a sigma of 10.1!

16250

We need updated charts 12X12... :lol:

And I don't get the math but I love reading the explanations. What does that mean for likelihood of a negative return?


The Charts that were made for σ0 also work with σx. The only difference is that they describe the chance of X% return instead of a 0%.
“The genius of investing is recognizing the direction of the trend – not catching the highs or the lows.”
- Dean Witter

"Put all your eggs in one basket and then watch that basket."
- Andrew Carnegie

RubberNeck
Posts: 12
Joined: Fri Jun 16, 2017 8:59 am

Re: What's the Risk?

Post by RubberNeck »

Huh???

User avatar
evilanne
Posts: 2067
Joined: Thu May 14, 2015 6:52 pm

Re: What's the Risk?

Post by evilanne »

Here is the referenced chart
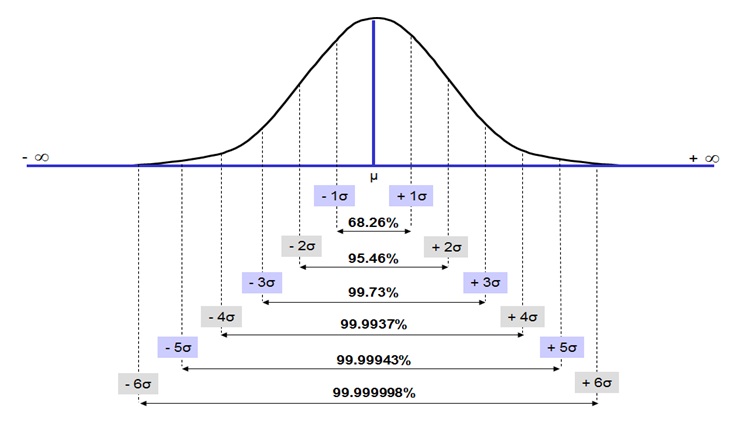
12squared wrote:The term "sigma" is used in the world of Quality Control as a metric of reliability. It is akin to the use of the decibel (dB) for sound and radio signal levels, in which ratios span great ranges, e.g. from micro to giga. Reliability is usually expressed as a 1 in a______ chance of defects. In the context of annual returns, I defined the defect limit as the 0% return, because anything less results in "loss of capital".
Image

The relative reliability of sigmas was calculated by dividing their respective Cumulative Normal Distributions obtained from Excel's NORMDIST function.
Image

User avatar
robika
Posts: 86
Joined: Tue Mar 08, 2016 8:56 am

Re: What's the Risk?

Post by robika »

fordest wrote:In case you missed it in the other thread, I found a sigma of 10.1!

16250

We need updated charts 12X12... :lol:

And I don't get the math but I love reading the explanations. What does that mean for likelihood of a negative return?
Hi everyone! Been on here for a little while but have never posted.

I believe I just came up with one that has a sigma of 12.08:
17823

This is a great tool, thanks mjedlin66 for all your work!
2019: Ignore everything that Mr. Imperfect says. Just roll the dice, will probably do better.
2020: Did Mr. Imperfect hack my fantasy account?
2021: My fantasy account got COVID.

User avatar
dougellen1
Posts: 123
Joined: Thu Mar 08, 2012 12:41 pm

Re: What's the Risk?

Post by dougellen1 »

is it possible for someone to extrapolate the tspcalc daily data strategies back to 1989? Would give us a more MACRO look at all of this. I know this is huge.....just asking. I would do it but can't figure it out.

User avatar
Sad Al
Posts: 107
Joined: Tue Jun 08, 2010 11:50 am

Re: What's the Risk?

Post by Sad Al »

Whoever came up with strategy #24823, you are my hero. Mean 30.12, standard deviation 1.78%. Ratio 16.92.

User avatar
fordest
Posts: 605
Joined: Wed Sep 26, 2012 3:48 pm

Re: What's the Risk?

Post by fordest »

Sad Al wrote:Whoever came up with strategy #24823, you are my hero. Mean 30.12, standard deviation 1.78%. Ratio 16.92.
Wow. Mine too...... and the lowest year: 26.93% Thanks for pointing this one out.
100% in the daily system since August 2, 2017.
Following strategy (current pick) #88676. 2020 real life has been following #110838

User avatar
Sad Al
Posts: 107
Joined: Tue Jun 08, 2010 11:50 am

Re: What's the Risk?

Post by Sad Al »

12squared wrote:
hmarkway wrote:So using your example, if the Mean/StdDev is 2.0, it is 99% likely that no more than 1.98 years out of 20 (20*0.099) will be negative, but at least (>0%) 0.456 years out of 20 (20*.0228) will be negative. Am I looking at this the correct way?
12squared wrote:Yes you are. In whole numbers, 1 year out of 40, the same as the the mean-2SD value.


I've been reading and re-reading these posts and calculations, including the confidence intervals. What I don't see is how you arrived at 20 years or 40 years, instead of using 100 or 1000 years, assuming we are looking at percentages expressed in years.

If the sigma is 2.0, it is 99% likely that no more than 9.9% of the years will be negative, which is 9.9 years of 100, or closer to 1 in 10, but a negative year could be expected at least 2.28% of the time, or about 23 times in 1000 years. Where does 20 and 40 come from?

Post Reply

Fund Prices2024-04-16

FundPriceDayYTD
G $18.19 0.01% 1.24%
F $18.58 -0.32% -3.33%
C $79.08 -0.21% 6.34%
S $76.95 -0.41% -0.18%
I $40.73 -0.98% 1.37%
L2065 $15.67 -0.50% 3.66%
L2060 $15.67 -0.50% 3.67%
L2055 $15.68 -0.50% 3.67%
L2050 $31.50 -0.44% 2.93%
L2045 $14.38 -0.41% 2.81%
L2040 $52.59 -0.38% 2.72%
L2035 $13.91 -0.35% 2.60%
L2030 $46.37 -0.32% 2.50%
L2025 $12.95 -0.18% 1.90%
Linc $25.31 -0.14% 1.64%

Live Charts

Pending Allocations

Under development. For now, you may view Pending Allocations by going to "fantasy TSP" and selecting "Leaderboard sort" of "Pending Allocations".