New Leader on TSPCalc
Moderator: Aitrus
Re: New Leader on TSPCalc
fordest,
You're right, I wasn't reading his posted numbers correctly. 2.25% would mean a very, very consistent SD.
Now I'm confused about the 12.2. Are you saying that he's dividing the mean by the STD? If so, what is the purpose? What is running that calculation meant to do?
You're right, I wasn't reading his posted numbers correctly. 2.25% would mean a very, very consistent SD.
Now I'm confused about the 12.2. Are you saying that he's dividing the mean by the STD? If so, what is the purpose? What is running that calculation meant to do?
Seasonal Musings 2022: viewtopic.php?f=14&t=19005
Recommended Reading: http://tspcenter.com/forums/viewtopic.php?f=14&t=13474
Support the site by purchasing a membership at TSPCalc! https://tspcalc.com
Recommended Reading: http://tspcenter.com/forums/viewtopic.php?f=14&t=13474
Support the site by purchasing a membership at TSPCalc! https://tspcalc.com
Re: New Leader on TSPCalc
It produces a number that shows the relationship between the Mean and the STD. A higher Mean and a lower STD produce a higher number. As for all the calculations and how those work.... it's all Greek to me. But it's explained pretty well throughout the "what's the risk?" Thread. (Sorry unable to link it now)
Re: New Leader on TSPCalc
Hmm...more learning and research is needed, methinks. I'm thinking it's something akin to Coefficient of Variation, which is something I still need to wrap my head around.
Thanks, fordest. Much appreciated.
Thanks, fordest. Much appreciated.
Seasonal Musings 2022: viewtopic.php?f=14&t=19005
Recommended Reading: http://tspcenter.com/forums/viewtopic.php?f=14&t=13474
Support the site by purchasing a membership at TSPCalc! https://tspcalc.com
Recommended Reading: http://tspcenter.com/forums/viewtopic.php?f=14&t=13474
Support the site by purchasing a membership at TSPCalc! https://tspcalc.com
Re: New Leader on TSPCalc
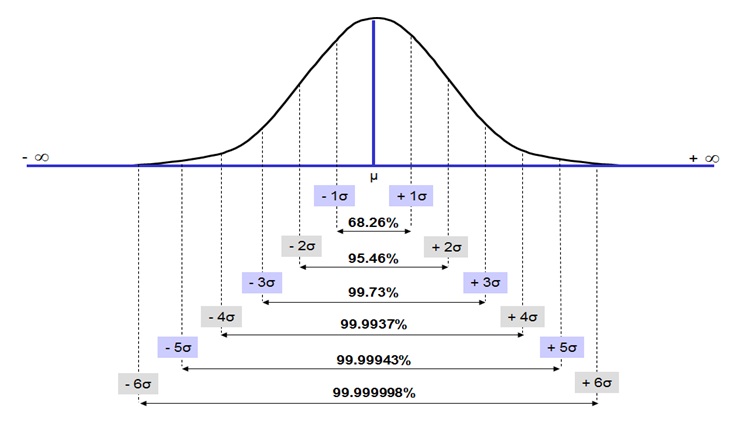
My understanding is that the higher the Mean/Standard Deviation or Sigma, the more confidence that you will not fall outside the range or have a negative return. The higher the probability that your return will fall within the Mean +/-( the Standard Deviation times the Sigma) If you look at 12sqared's chart at http://tspcenter.com/forums/viewtopic.php?f=14&t=14940
If Mean = 30 & SD = 15, Sigma is 2 or 95.46 Confidence Level that Return will fall between 0% & 60%
If Mean = 30 & SD = 6, Sigma is 5 or 99.99943 Confidence Level that Return will fall between 0% & 60%
In the above example, the latter is less risky although the range is the same --The likelihood of falling outside the range is much less with the lower SD given the same mean. The size of tail area is pushed out with higher sigma based on the lower SD.
Note: There is always risk of a negative return no matter how high the sigma because there are many factors influencing the markets and some unusual or some extremely unlikely event could (e.g. 9/11, bubble burst or Great Recession). Markets are not always rational.
Example:12squared wrote: The term "sigma" is used in the world of Quality Control as a metric of reliability. It is akin to the use of the decibel (dB) for sound and radio signal levels, in which ratios span great ranges, e.g. from micro to giga. Reliability is usually expressed as a 1 in a______ chance of defects. In the context of annual returns, I defined the defect limit as the 0% return, because anything less results in "loss of capital".
The relative reliability of sigmas was calculated by dividing their respective Cumulative Normal Distributions obtained from Excel's NORMDIST function.

If Mean = 30 & SD = 15, Sigma is 2 or 95.46 Confidence Level that Return will fall between 0% & 60%
If Mean = 30 & SD = 6, Sigma is 5 or 99.99943 Confidence Level that Return will fall between 0% & 60%
In the above example, the latter is less risky although the range is the same --The likelihood of falling outside the range is much less with the lower SD given the same mean. The size of tail area is pushed out with higher sigma based on the lower SD.
Note: There is always risk of a negative return no matter how high the sigma because there are many factors influencing the markets and some unusual or some extremely unlikely event could (e.g. 9/11, bubble burst or Great Recession). Markets are not always rational.
Re: New Leader on TSPCalc
This is very confusing.
- Jokerswild
- Posts: 115
- Joined: Wed Feb 22, 2017 5:58 pm
Re: New Leader on TSPCalc
01010100011011110110111100100000011000110110111101101110011001100111010101110011011010010110111001100111001000000110011001101111011100100010000001101101011001010010110000100000010010010010000001110111011010010110110001101100001000000111001101110100011010010110001101101011001000000111011101101001011101000110100000100000011011010111100100100000011001000110000101101001011011000111100100100000011100110110010101100001011100110110111101101110011000010110110000101110 
Shawn AKA "Joker"
"How many millionaires do you know who have become wealthy by investing in savings accounts? I rest my case." - Robert G. Allen
"How many millionaires do you know who have become wealthy by investing in savings accounts? I rest my case." - Robert G. Allen
Fund Prices2024-04-18
| Fund | Price | Day | YTD |
| G | $18.19 | 0.01% | 1.27% |
| F | $18.62 | -0.30% | -3.14% |
| C | $78.45 | -0.21% | 5.50% |
| S | $76.12 | -0.20% | -1.27% |
| I | $40.67 | 0.02% | 1.21% |
| L2065 | $15.58 | -0.13% | 3.04% |
| L2060 | $15.58 | -0.13% | 3.04% |
| L2055 | $15.58 | -0.13% | 3.04% |
| L2050 | $31.35 | -0.13% | 2.44% |
| L2045 | $14.32 | -0.12% | 2.35% |
| L2040 | $52.37 | -0.11% | 2.29% |
| L2035 | $13.85 | -0.10% | 2.21% |
| L2030 | $46.21 | -0.09% | 2.15% |
| L2025 | $12.93 | -0.05% | 1.72% |
| Linc | $25.28 | -0.04% | 1.51% |

