

I posted the recent history of Seasonal Investing in terms of investing only for half of the year - favorable and unfavorable season. Here is one of the charts.
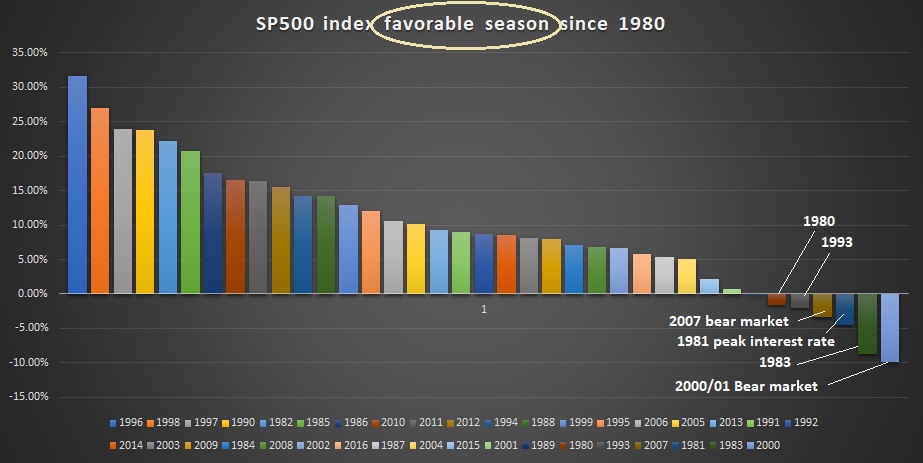
I think taking a look at these charts helps with determining what influences the market's seasonal effects - bear markets and recently quantitative easing (QE) have played a large role. You can take a look at the other charts in the post here.
I think the current market melt up is due to the 4 trillion dollars of purchases by the BOJ and ECB with money created out-of-thin-air in 2016 and 3 trillion in 2017. QE has led to three descent summer gains this market cycle - the current one ending included.
The issue is how and when the market is going to climb down from current valuation and high corporate debt levels.
Michael
