Just understand you are buying high today

General TSP Discussion.

Moderator: Aitrus

Post Reply
User avatar
TSPsmart
Posts: 212
Joined: Fri Nov 14, 2014 12:24 pm

Just understand you are buying high today

Post by TSPsmart »

There are a lot of discussions about allocations on this website. Traders of course tend to buy and sell alot. Those who have allocated heavy to the equity funds are leading the pack in past returns and I congratulate your successes.

But for those new to considering your investments, please understand we are near the end of a very long cycle. Not the business cycle or stock market cycle or even the earnings cycle, but a global credit cycle. We are reaching peak everything because of it. That's over 200 years...

Image

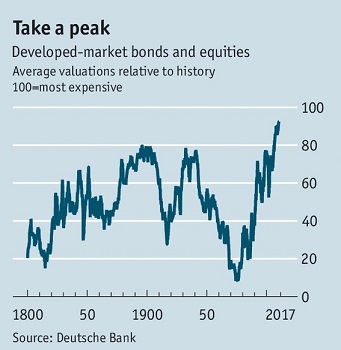
Does this mean sell everything today? No. It just means past performance really should not be used to assume similar future returns. When your standing well within the top 1% and maybe the top of all historical financial asset valuations, past returns will never look better.

Much of what worked in the past will not work sometime soon in the future.

As for seasonal investing, I believe the seasonal influences are always there and they will continue to beat buy & hold over the long term. I expect SP500 to be no higher than today 12 years from now barring high inflation. I expect seasonal strategies to beat this by a couple of percent annually depending on the strategy and fund.

I also believe over the short term other factors can overwhelm the seasonal currents. Missing the next bear market would allow you to achieve higher returns over the next 12 years.

The Fed chair said this week that while valuations are high, they may not be over-valued because we are in a low interest rate environment. She failed to mention the central banks have manipulated interest rates lower than free-markets would have allowed and they are now trying to figure out how to unscrew the markets.

I discussed her premise in my post "Not Overvalued"

I know there are many different views on the market and how to play it. I just want newbies and others to understand that at some point market valuations will matter again.

John316
Posts: 149
Joined: Fri Nov 05, 2010 7:43 am

Re: Just understand you are buying high today

Post by John316 »

Thank you for some wise analysis. Fundamentals always matter, even in a bull market. Thanks again. God bless everyone this Christmas season. :D

User avatar
ArrieS
Posts: 1072
Joined: Sun Aug 05, 2012 10:56 am

Re: Just understand you are buying high today

Post by ArrieS »

TSPsmart wrote:She failed to mention the central banks have manipulated interest rates lower than free-markets would have allowed and they are now trying to figure out how to unscrew the markets.
Is that true?

Despite the ongoing Fed’s tightening cycle, the spread between the yields on 10-year and 2-year Treasury notes has recently reached its lowest point since November 2007.

While short-term rates have been rising, long-term rates have simply not responded and many are predicting an inversion in a year or so. That would indicate the FED is driving rates higher on short-term bonds than the market would have.
OCTOBER: This is one of the peculiarly dangerous months to speculate in stocks in. The others are July, January, September, April, November, May, March, June, December, August, and February. - Pudd'nhead Wilson's Calendar

mindofmush
Posts: 353
Joined: Mon Jul 02, 2012 1:38 pm

Re: Just understand you are buying high today

Post by mindofmush »

The Dynamic Yield Curve is a graphical display of the short and long term yields of Treasury Notes. It is currently NORMAL.

The Dynamic Yield Curve became flat/inverted in November 1999, giving 10 months of warning prior to the crash beginning September 2000.

The Dynamic Yield Curve became flat/inverted in February 2006, giving 17 months of warning while it ran up to new all time highs prior to the Great Recession beginning July 2007.

The market has been making new all time highs up to the market corrections in August 2015 and January 2016 and since then too. The Dynamic Yield Curve is normal which means that I'm not worried about the next BIG correction occurring anytime soon. Until I see the curve flatten or invert (coupled with a few others econ indicators), I'm going to take advantage of the momentum in the market by staying in stocks.

You won't lose any money if you follow the CNN "the sky is falling" advice into the G fund (depending on how long before the Treasury replaces what it took) but you could miss out fattening up your nestegg.
mo meng, mo ching (which loosely means: no money, no life)

searight
Posts: 85
Joined: Wed Jan 16, 2013 8:56 am

Re: Just understand you are buying high today

Post by searight »

You can also link the stock market to the demographics of the baby boomers(53 to 71 yr olds). Baby boomers are currently heavy equity investors as well as their pension plans. They are the largest population group in the affluent parts of the world, making the best money of their lives and investing the highest percentages. They are trying to "catch up" to where they think they should be for retirement. By 2021, 50% of them will have retired and many moving out of equities to lower risk investments. So this may be like running up a mountain only to fall off a cliff when we get to the top.

IMHO, this has driven and will drive the bull market, but it cannot last forever and has to eventually correct itself. The only good part is that when the fall starts some will move their money into "safer" parts of the world which will happen to be the US. Other world markets will be hit harder.

SnareMV17
Posts: 176
Joined: Thu Jan 10, 2013 9:06 am

Re: Just understand you are buying high today

Post by SnareMV17 »

SPEC-U-LATION clap clap clap-clap-clap!
"Get your money for nothin', and your chicks for free."

Following TSPCalc strategy #64902.

User avatar
cswift01
Posts: 819
Joined: Thu Dec 08, 2016 10:46 am

Re: Just understand you are buying high today

Post by cswift01 »

mindofmush wrote:The Dynamic Yield Curve is a graphical display of the short and long term yields of Treasury Notes. It is currently NORMAL.

The Dynamic Yield Curve became flat/inverted in November 1999, giving 10 months of warning prior to the crash beginning September 2000.

The Dynamic Yield Curve became flat/inverted in February 2006, giving 17 months of warning while it ran up to new all time highs prior to the Great Recession beginning July 2007.

The market has been making new all time highs up to the market corrections in August 2015 and January 2016 and since then too. The Dynamic Yield Curve is normal which means that I'm not worried about the next BIG correction occurring anytime soon. Until I see the curve flatten or invert (coupled with a few others econ indicators), I'm going to take advantage of the momentum in the market by staying in stocks.

You won't lose any money if you follow the CNN "the sky is falling" advice into the G fund (depending on how long before the Treasury replaces what it took) but you could miss out fattening up your nestegg.
Which website has a good indicator of the curve? May you share a link?

User avatar
zobtraffic
Posts: 40
Joined: Mon Sep 19, 2011 1:15 pm

Re: Just understand you are buying high today

Post by zobtraffic »

https://youtu.be/8sKSd0FrrYk
Another perspective worth watching.

mindofmush
Posts: 353
Joined: Mon Jul 02, 2012 1:38 pm

Re: Just understand you are buying high today

Post by mindofmush »

Stockcharts.com has many free charts and services (with ads); the Dynamic Yield Curve can be found at:

http://stockcharts.com/freecharts/yieldcurve.php

I'm sure that info about the yield curve or the spread can be found on many sites but I like Stockcharts a lot.
mo meng, mo ching (which loosely means: no money, no life)

User avatar
TSPsmart
Posts: 212
Joined: Fri Nov 14, 2014 12:24 pm

Re: Just understand you are buying high today

Post by TSPsmart »

ArrieS wrote: Is that true [...the central banks have manipulated interest rates lower than free-markets would have allowed]?

Despite the ongoing Fed’s tightening cycle, the spread between the yields on 10-year and 2-year Treasury notes has recently reached its lowest point since November 2007.

While short-term rates have been rising, long-term rates have simply not responded and many are predicting an inversion in a year or so. That would indicate the FED is driving rates higher on short-term bonds than the market would have.
Note I wrote "central banks" and not just the Fed.

The long end of the Treasuries is being pushed down thanks to the trillions in European and Japan's government debt driven into negative interest rates. Money in search of yield will flow into the US bonds driving price up and interest rates down.

The markets are completely detached from fundamentals and driven by global central bank faux-monetary policy.

Most of the long term government bonds in the developed world are now owned by the central banks who do not care about price or losses and purchase them with money created out of thin air. The central banks took over bond pricing to suppress interest rates and so we do not know what flattening credit spreads signals anymore.

I believe they signal divergent global monetary policy more than a pending recession which is equally troubling.

The new tax bill will challenge the central banks. Higher deficits mean more US government borrowing and a larger supply of treasuries available which tends to drive interest rates up. Basic supply and demand or private sector crowding out unless the Fed monetizes the new debt which is the opposite of what they are doing now.

Monetization will come after the next financial crisis caused by interest rates rising higher than expected. And remember the last recession was triggered and deepened by a financial crisis and not the other way around.

Post Reply

Fund Prices2024-04-17

FundPriceDayYTD
G $18.19 0.01% 1.25%
F $18.68 0.50% -2.85%
C $78.62 -0.58% 5.72%
S $76.27 -0.89% -1.07%
I $40.66 -0.17% 1.19%
L2065 $15.60 -0.47% 3.17%
L2060 $15.60 -0.47% 3.18%
L2055 $15.60 -0.47% 3.18%
L2050 $31.39 -0.35% 2.57%
L2045 $14.34 -0.33% 2.47%
L2040 $52.43 -0.31% 2.41%
L2035 $13.87 -0.28% 2.31%
L2030 $46.25 -0.25% 2.24%
L2025 $12.93 -0.12% 1.78%
Linc $25.29 -0.09% 1.55%

Live Charts

Pending Allocations

Under development. For now, you may view Pending Allocations by going to "fantasy TSP" and selecting "Leaderboard sort" of "Pending Allocations".