

First I posted some thoughts on the best TSP Fund now.
I also found a non-typical seasonal pattern this last year. I am sure there is some flow of funds that explains it that I will discover in the future but for now we just have a pattern to ponder.
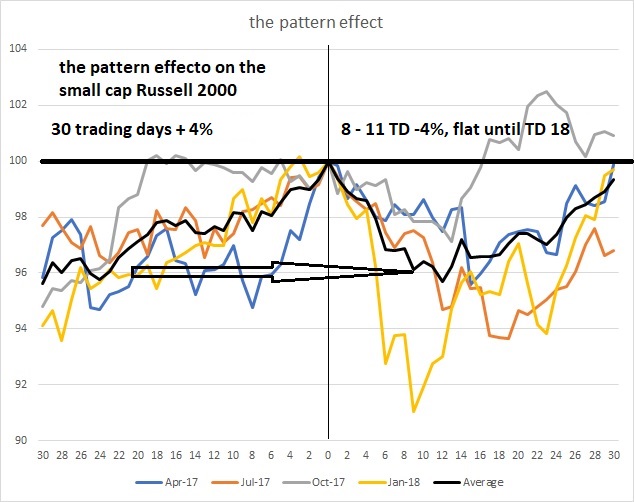
Stocks have peaked anywhere between 2 trading days and 5 trading days prior to the end of the month every 3 months. So if the pattern repeats the markets tail wind will turn to a strong head wind around 26-27 April. For small caps such as the Russell 2000 they have given up all their previous 30 day trading gains in about 8 - 12 trading days.
This is pattern does not fit with the typical pattern we see with our trading day TSP Almanacs, so I think it is a short-term pattern.
Anyway, something to watch for... or step out of the way.
Cheers,


