Fourier Analysis of S&P 500 Using Trigonometric Regression
Posted: Thu Apr 12, 2012 5:15 pm
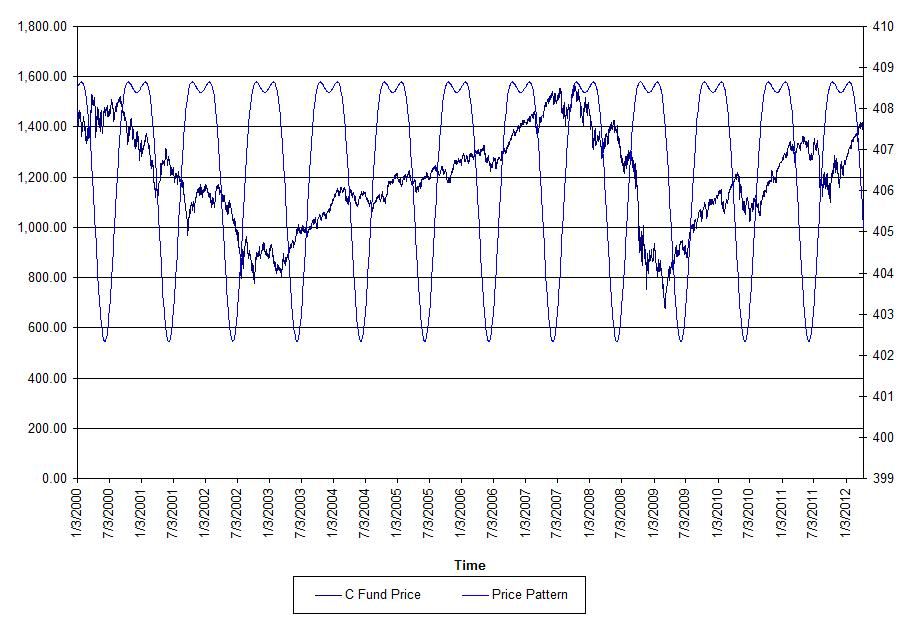
This is my first analysis using spectral analysis techniques. I am posting it for informational use only.
Here is the chart:
Method:
Excel columns:
time = t= 1+ tstart
e= 2*PI()*t/365
cos(e)
sin(e)
cos(2e)
sin(2e)
Regression (Price Pattern) = Intercept+X Variable 1*COS(2*PI()*t/365)+X Variable 2*COS(2*PI()*t/365)+X Variable 3*COS(4*PI()*t/365)+X Variable 4*COS(4*PI()*t/365)
Used regression analysis to obtain coefficients:
Coefficients
Intercept 406.5036175
X Variable 1 0.603012855
X Variable 2 2.426697184
X Variable 3 0.664379511
X Variable 4 -1.801693773