Earlier this month I posted charts supporting the longer term trajectory http://tspcenter.com/forums/viewtopic.php?f=9&t=12039 I hope this was useful to the seasonal and longer term position traders.
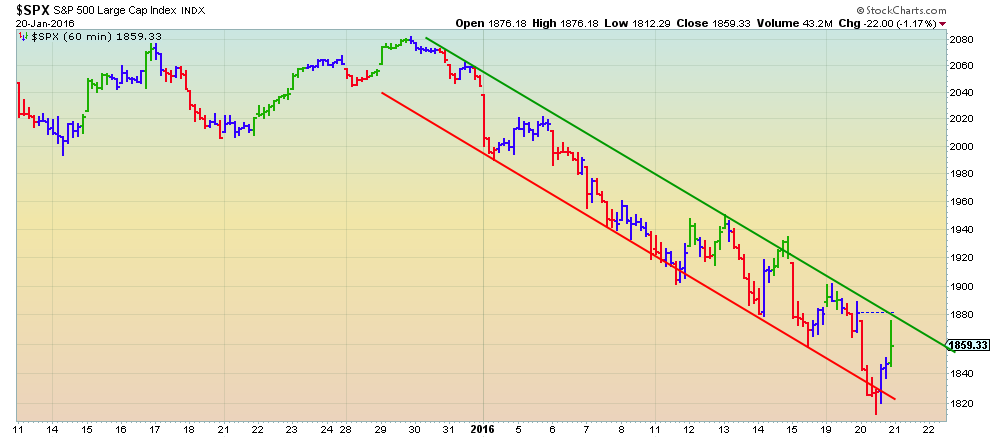
The following chart shows the short term trajectory of the stock market represented by the S&P 500. I hope this chart proves useful to the more aggressive traders.
http://tspadvantage.org/wp-content/uploads/2016/01/hourchart.png
Each vertical bar on this chart represents 1 hour of trading. The directional changes within the red & green diagonal range bars are moving too fast to execute IFT's to any advantage. We will need to see a decisive break of the upper green trend bar to suggest a trend change may be underway.
Short Term Tragectory
Moderator: Aitrus
Re: Short Term Tragectory
The trend broke sharply to the upside this morning but hit resistance at 1900. If it can break and hold above 1900 the next resistance level is 1930.
Fund Prices2024-04-24
Fund | Price | Day | YTD |
G | $18.20 | 0.01% | 1.34% |
F | $18.64 | -0.24% | -3.04% |
C | $79.40 | 0.02% | 6.78% |
S | $78.08 | -0.18% | 1.28% |
I | $41.48 | -0.10% | 3.23% |
L2065 | $15.84 | -0.05% | 4.74% |
L2060 | $15.84 | -0.05% | 4.75% |
L2055 | $15.84 | -0.05% | 4.75% |
L2050 | $31.79 | -0.06% | 3.86% |
L2045 | $14.51 | -0.05% | 3.68% |
L2040 | $53.01 | -0.05% | 3.54% |
L2035 | $14.01 | -0.04% | 3.36% |
L2030 | $46.69 | -0.04% | 3.21% |
L2025 | $13.01 | -0.02% | 2.33% |
Linc | $25.40 | -0.02% | 2.00% |