

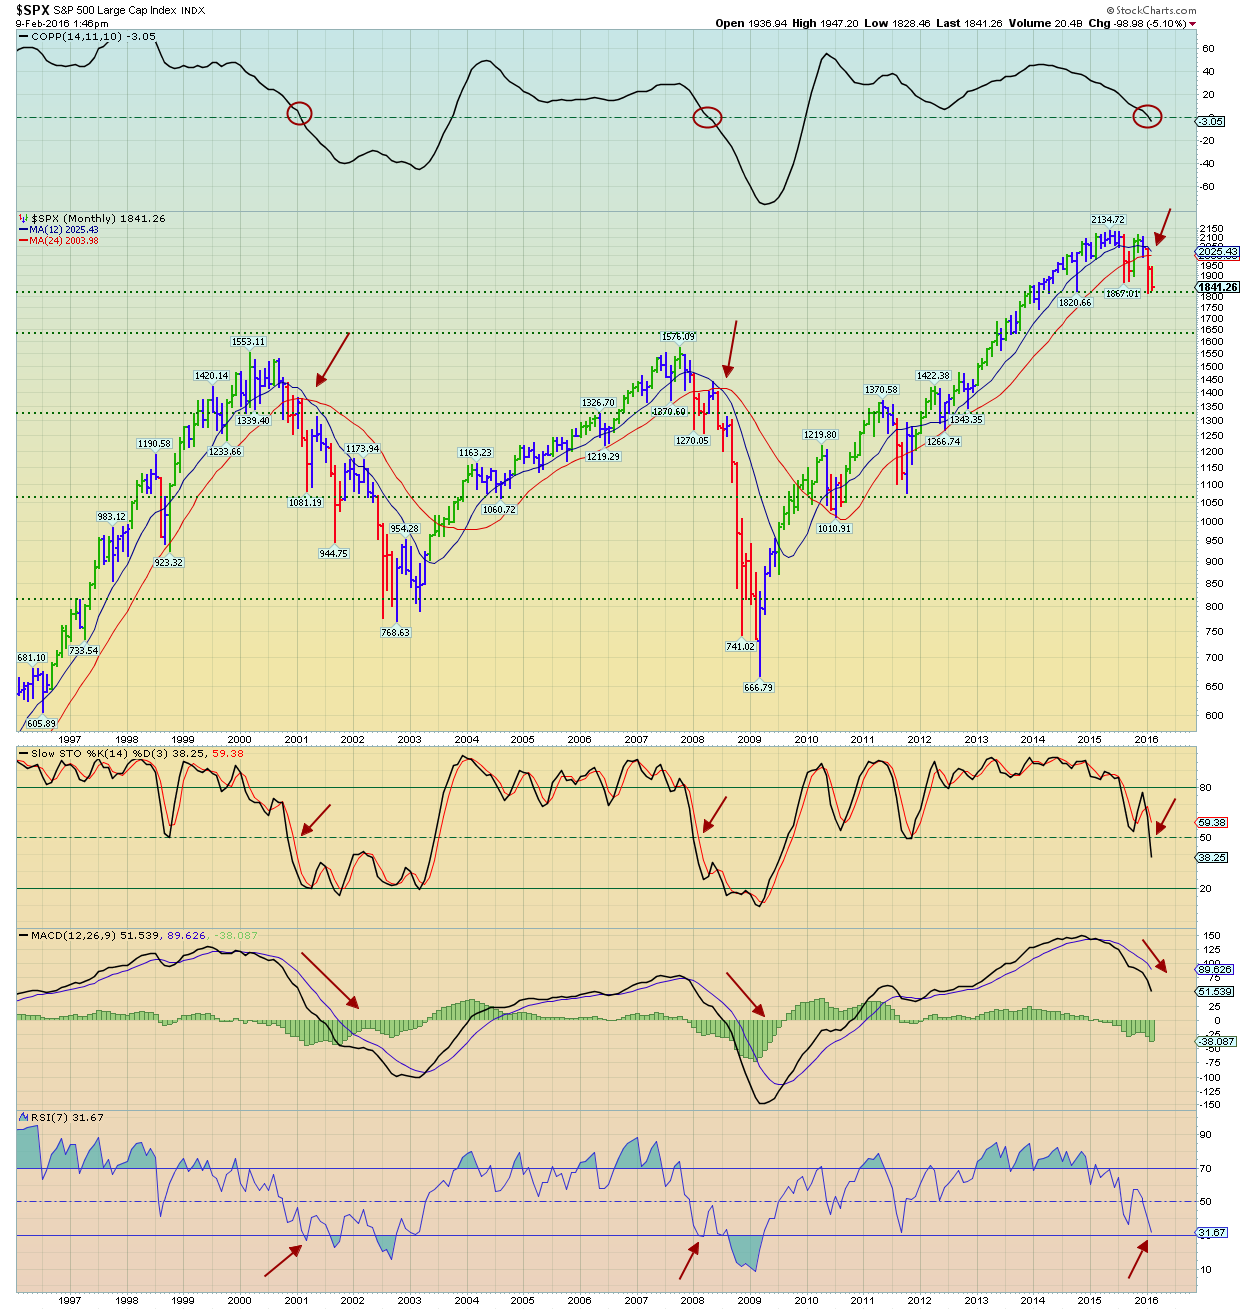
The 1st indicator, situated above the S&P 500 Chart, is the Coppock Curve. Notice that the indicator recently dropped below the zero line. This has only occurred on 2 other occasions in the past 20 years.
The indicators below the chart, SLO STO, MACD, and RSI are also confirming the down trend.
While the market can certainly begin to turn around at any time, the monthly chart will continue to be in a down trend until the May 2015 high of 2,134 is broken.
As for the down side potential, we just broke past the August low of 1,867 for the second time. The next critical crossroad is the 1,812 low of Jan 20.
If 1,812 is breached the next significant resistance levels fall between 1,553 & 1,631. The 2000 & 2007 highs and the 23.6% Fibonacci retracement level.
If these levels don't hold the next resistance level is 1,319. This would put the market at a Fibonacci 38.2% retracement.
Short term traders should look for bounces at these levels for some potential short term profits.
But as each level is breached you would be wise to step aside. Bear markets can fall fast.
