When the major indexes appear to be at a crossroad and generating mixed signals I find the "Value Line Geometric Index" can often provide some clarity.
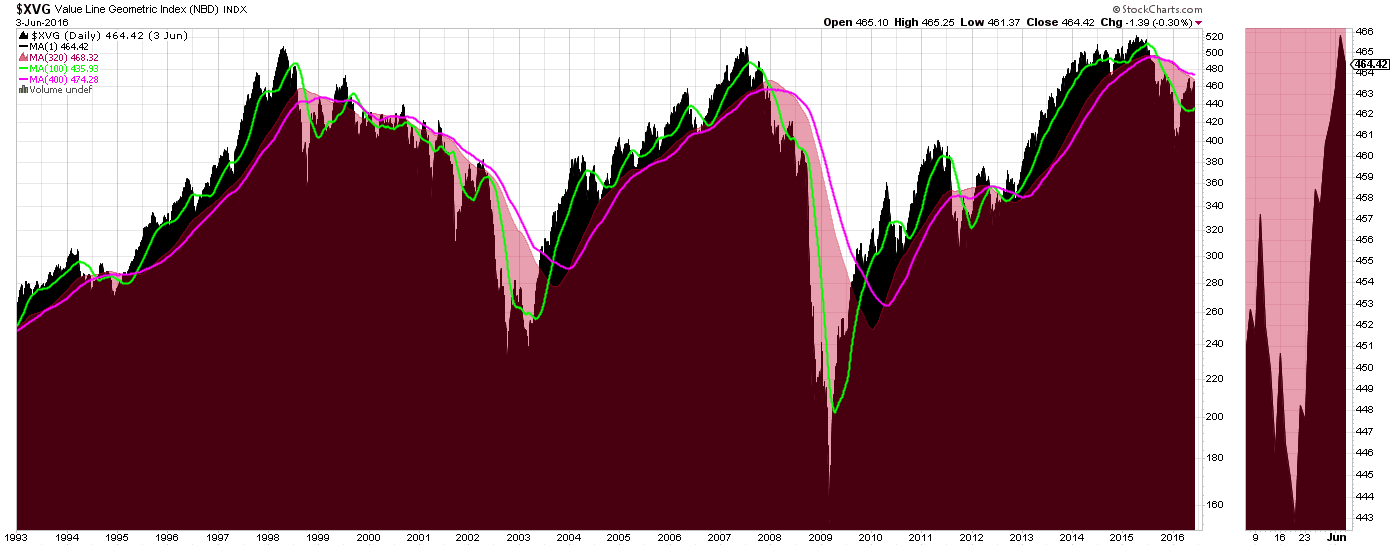
While the bounce up from the February low was strong we are seeing significant resistance at these levels. A Breakout from here could be signaling a move to new highs but I suspect it could be short lived.
My latest TSP Charts for May can be viewed at:
TSP Advantage June Update
Moderator: Aitrus
- Tomanyiron
- Posts: 4973
- Joined: Mon Apr 26, 2010 6:39 am
Re: TSP Advantage June Update
Thanks Relevant for the chart. I took the $XVG chart, added a few things I consider worthy of noting.
http://schrts.co/zGPXav
"A good decision is based on knowledge and not on numbers." Plato
"Perfect numbers like perfect men are very rare." Rene Descartes
Fund Prices2024-04-17
Fund | Price | Day | YTD |
G | $18.19 | 0.01% | 1.25% |
F | $18.68 | 0.50% | -2.85% |
C | $78.62 | -0.58% | 5.72% |
S | $76.27 | -0.89% | -1.07% |
I | $40.66 | -0.17% | 1.19% |
L2065 | $15.60 | -0.47% | 3.17% |
L2060 | $15.60 | -0.47% | 3.18% |
L2055 | $15.60 | -0.47% | 3.18% |
L2050 | $31.39 | -0.35% | 2.57% |
L2045 | $14.34 | -0.33% | 2.47% |
L2040 | $52.43 | -0.31% | 2.41% |
L2035 | $13.87 | -0.28% | 2.31% |
L2030 | $46.25 | -0.25% | 2.24% |
L2025 | $12.93 | -0.12% | 1.78% |
Linc | $25.29 | -0.09% | 1.55% |