A New Seasonal Pattern?

General TSP Discussion.

Moderator: Aitrus

Post Reply
User avatar
TSPsmart
Posts: 212
Joined: Fri Nov 14, 2014 12:24 pm

A New Seasonal Pattern?

Post by TSPsmart »

A couple of point outs.

First I posted some thoughts on the best TSP Fund now.

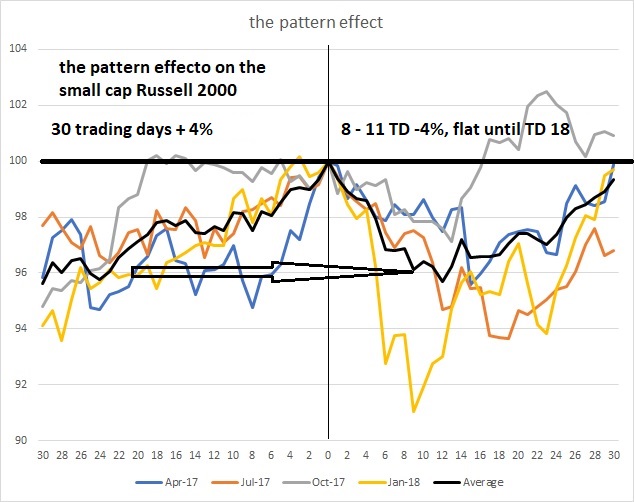
I also found a non-typical seasonal pattern this last year. I am sure there is some flow of funds that explains it that I will discover in the future but for now we just have a pattern to ponder.
Image

Stocks have peaked anywhere between 2 trading days and 5 trading days prior to the end of the month every 3 months. So if the pattern repeats the markets tail wind will turn to a strong head wind around 26-27 April. For small caps such as the Russell 2000 they have given up all their previous 30 day trading gains in about 8 - 12 trading days.

This is pattern does not fit with the typical pattern we see with our trading day TSP Almanacs, so I think it is a short-term pattern.

Anyway, something to watch for... or step out of the way.

Cheers,

greengrass
Posts: 334
Joined: Fri Jan 11, 2013 9:28 am

Re: A New Seasonal Pattern?

Post by greengrass »

I'm wondering how much cryptos, interest rates, and tarrifs will change this year. It's a lot to take in, great posts btw.

mindofmush
Posts: 353
Joined: Mon Jul 02, 2012 1:38 pm

Re: A New Seasonal Pattern?

Post by mindofmush »

Writers from Zacks and from Interactive Brokers have stated that 2017 is a financial freak, an outlier and not something to model the future after.

I don't understand your graph; I know April isn't 60 days long so what day in April does the 0 point reference on the blue April line? The beginning, the 15th, the end?
mo meng, mo ching (which loosely means: no money, no life)

User avatar
Elkhunter
Posts: 27
Joined: Sat Mar 03, 2018 11:43 pm

Re: A New Seasonal Pattern?

Post by Elkhunter »

so go to G from the 26th-29th, is what I took from this pattern, or am I way off?
Jesus, please guide us is all we do?

User avatar
jlozano042
Posts: 836
Joined: Tue Apr 04, 2017 12:37 pm

Re: A New Seasonal Pattern?

Post by jlozano042 »

Elkhunter wrote:so go to G from the 26th-29th, is what I took from this pattern, or am I way off?
I think the opposite .... go into C/S (maybe a splash of "I") on the last few days of the month for that quick gain.

I went and looked at the last week from the past 6 months and there seems to be an increase of gains for the main funds. Don't know how to explain it but something to take note of - interesting.

User avatar
Snapdragon
Posts: 251
Joined: Tue Jan 29, 2013 5:26 pm

Re: A New Seasonal Pattern?

Post by Snapdragon »

I see it as lock in your gains next week and wait for the dip thats coming in May.

User avatar
jlozano042
Posts: 836
Joined: Tue Apr 04, 2017 12:37 pm

Re: A New Seasonal Pattern?

Post by jlozano042 »

Snapdragon wrote:I see it as lock in your gains next week and wait for the dip thats coming in May.
I don't know ..... this has been a flip-flop year. Something inside me .... somewhere near the gallbladder and the ascending colon region, is telling me to stay in and do the opposite. :?

User avatar
Snapdragon
Posts: 251
Joined: Tue Jan 29, 2013 5:26 pm

Re: A New Seasonal Pattern?

Post by Snapdragon »

Thats why when I pull money off the table, I leave at least a little in, because it pisses me off when markets keep going up unexpectedly and I'm not making money. Granted, if I'm only 10% in, its not much, but its more than nothing.
Many people don't like to do that, but I do.

User avatar
jlozano042
Posts: 836
Joined: Tue Apr 04, 2017 12:37 pm

Re: A New Seasonal Pattern?

Post by jlozano042 »

Good point!

User avatar
TSPsmart
Posts: 212
Joined: Fri Nov 14, 2014 12:24 pm

Re: A New Seasonal Pattern?

Post by TSPsmart »

Yes, if the pattern holds one might reduce allocations around the 26th especially small caps. The large caps have flat-lined or pulled back less. Then again, they do not rally as much either going into it.

I work in trading days, not calendar. I do anchor off calendar days, but in this case day 0 is the peak in the Russell 2000 that was reached anywhere between 2 and 5 days prior to the end of the month in the 4 periods we looked at.

30 trading days is about a month and a half. The pattern is 3 months, or 60-65 trading days.

Historically you often get a bump in the market on average plus or minus a couple of trading days at the turn-of-the-month. So this pattern does not fit. It does not fit options expiration either.

It does occur at the end of the month where earnings announcements occur (Jan, April, July, Oct) so I pondered the lockup of buybacks ending, or an earnings effect to explain the rally. But this does not explain the corrections.

More likely this is some sort of central bank liquidity operations I am not aware of at this time. Two of the peaks matched the sell down of the Fed's balance sheet, but otherwise it does not look correlated to balance sheet reductions.

Post Reply

Fund Prices2024-04-17

FundPriceDayYTD
G $18.19 0.01% 1.25%
F $18.68 0.50% -2.85%
C $78.62 -0.58% 5.72%
S $76.27 -0.89% -1.07%
I $40.66 -0.17% 1.19%
L2065 $15.60 -0.47% 3.17%
L2060 $15.60 -0.47% 3.18%
L2055 $15.60 -0.47% 3.18%
L2050 $31.39 -0.35% 2.57%
L2045 $14.34 -0.33% 2.47%
L2040 $52.43 -0.31% 2.41%
L2035 $13.87 -0.28% 2.31%
L2030 $46.25 -0.25% 2.24%
L2025 $12.93 -0.12% 1.78%
Linc $25.29 -0.09% 1.55%

Live Charts

Pending Allocations

Under development. For now, you may view Pending Allocations by going to "fantasy TSP" and selecting "Leaderboard sort" of "Pending Allocations".