

My position: 100% G.
AGG / F Fund:...
F still in decline, stay away
SPX / C Fund:...
If you follow FIBS Logic, we should be near the 50% retrace on STO, MACD has rolled over.. I'm looking at getting back in about Tuesday at this rate.
DWCPF / S Fund:...
S, Same as C Fund,
EFA / I Fund:...
I Fund makes it 3 for 3, MACD has rolled over, STO is at 50% FIBS.
Past 5 days returns..
F Fund... -1.48%
C Fund... -2.19%
S Fund... -4.17%
I Fund.... -2.76%
Other Charts....
DOW Index , CNBC Pre-Markets
Hopefully you are in G fund for the ride down.
TSP Forecast Apr
Moderator: Aitrus
TSP Forecast Apr
Just because I give you advice, It doesn't mean I know more than you, It just means I've done more stupid stuff.
Re: TSP Forecast Apr
Just a quick note..
I think yesterday (12th) would have been the day to get back in,
C, S and I funds.. Slow STO's are below 20, C has reached resistance levels from early Mar and mid Jan, the others have passed the resistance with little effect, so I don't know if it really means much now..,
I'm looking for a relatively down day today and I'm back in S Fund.
Snaffu
Just because I give you advice, It doesn't mean I know more than you, It just means I've done more stupid stuff.

Re: TSP Forecast Apr
S looks like the fastest horse right now, based on VXF:SPY and VXF:EFAsnaffu wrote: ↑Thu Apr 14, 2022 6:20 am I think yesterday (12th) would have been the day to get back in,
C, S and I funds.. Slow STO's are below 20, C has reached resistance levels from early Mar and mid Jan, the others have passed the resistance with little effect, so I don't know if it really means much now..,
I'm looking for a relatively down day today and I'm back in S Fund.
“The genius of investing is recognizing the direction of the trend – not catching the highs or the lows.”
- Dean Witter
"Put all your eggs in one basket and then watch that basket."
- Andrew Carnegie
- Dean Witter
"Put all your eggs in one basket and then watch that basket."
- Andrew Carnegie


Re: TSP Forecast Apr
Bloobs,
I use Std Dev as measure of mean reversion and trend direction, but not as a measure of volatility. Could you provide a comparison of S/VXF/$DWFCP on the basis of own its previous performance, or as a comparison with other funds?
What are you using to forecast/predict S?
12²
“The genius of investing is recognizing the direction of the trend – not catching the highs or the lows.”
- Dean Witter
"Put all your eggs in one basket and then watch that basket."
- Andrew Carnegie
- Dean Witter
"Put all your eggs in one basket and then watch that basket."
- Andrew Carnegie
Re: TSP Forecast Apr
12^2 - i just amateurishly created and eyeballed this 1-year IVV vs VXF price change comparison chart that illustrates the deviation differences and the occasional divergence between their price actions.12squared wrote: ↑Thu Apr 14, 2022 9:16 amBloobs,
I use Std Dev as measure of mean reversion and trend direction, but not as a measure of volatility. Could you provide a comparison of S/VXF/$DWFCP on the basis of own its previous performance, or as a comparison with other funds?
What are you using to forecast/predict S?
12²

Re: TSP Forecast Apr
You could plot the standard deviation, but it would be tough to compare because the base prices are on different scales. Bollinger Band Widths normalize this.bloobs wrote: ↑Thu Apr 14, 2022 9:30 am12^2 - i just amateurishly created and eyeballed this 1-year IVV vs VXF price change comparison chart that illustrates the deviation differences and the occasional divergence between their price actions.12squared wrote: ↑Thu Apr 14, 2022 9:16 amBloobs,
I use Std Dev as measure of mean reversion and trend direction, but not as a measure of volatility. Could you provide a comparison of S/VXF/$DWFCP on the basis of own its previous performance, or as a comparison with other funds?
What are you using to forecast/predict S?
12²
On StockCharts they look like this.
https://stockcharts.com/h-sc/ui?s=VXF&p ... 0141602347
https://stockcharts.com/h-sc/ui?s=IVV&p ... 0141602347
I'm not familiar with TradingView. Can it display a function (e.g. Std Dev or moving average) of two stocks side by side as it does for their prices?
“The genius of investing is recognizing the direction of the trend – not catching the highs or the lows.”
- Dean Witter
"Put all your eggs in one basket and then watch that basket."
- Andrew Carnegie
- Dean Witter
"Put all your eggs in one basket and then watch that basket."
- Andrew Carnegie
Re: TSP Forecast Apr
I could use BB, but the problem with using a BB indicators is that I cant compare its volatility (stddev) with another index(es) on the same chart--at least not without getting a headache first12squared wrote: ↑Thu Apr 14, 2022 10:26 amYou could plot the standard deviation, but it would be tough to compare because the base prices are on different scales. Bollinger Band Widths normalize this.
On StockCharts they look like this.
https://stockcharts.com/h-sc/ui?s=VXF&p ... 0141602347
https://stockcharts.com/h-sc/ui?s=IVV&p ... 0141602347
I'm not familiar with TradingView. Can it display a function (e.g. Std Dev or moving average) of two stocks side by side as it does for their prices?
I do like the free Tradingview charts on TSPCENTER (thanks again MJ) but I am not sure if it could do the side-by-side comparisions you mentioned.
Re: TSP Forecast Apr
My position: 100% S.
AGG / F Fund:...
F Nothing new here.. still in decline, stay away
SPX / C Fund:...
So far, FIBS has worked, Slow STO has started to turn up, MACD has not caught up yet, but I think it will. It looks like price has bounced off support from early march. I think its time to get back into C or S funds.
DWCPF / S Fund:...
S, Same as C Fund,
EFA / I Fund:...
I dont know how to read this one.. There are gaps in early and mid March which could act as support now, I dont think I would get into I Fund now, It has not gained much in the past 2 month overall.
Past 5 days returns..
F Fund... -1.14%
C Fund... 1.15%
S Fund... 2.41%
I Fund.... -0.56%
Other Charts....
DOW Index , CNBC Pre-Markets
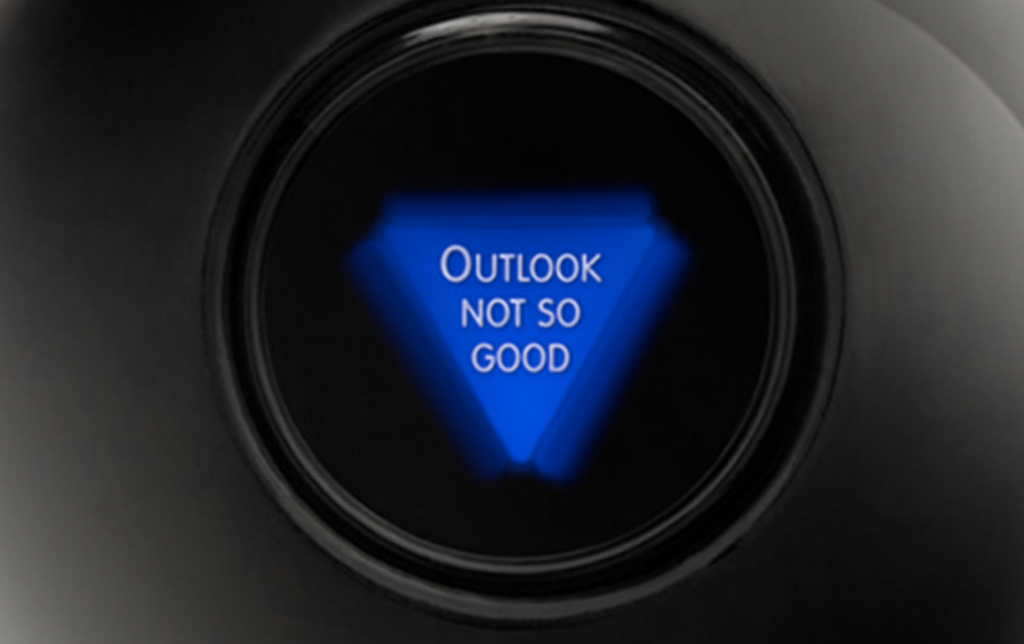
My Magic 8 ball says S fund is the place to be for the next week or so.
Snaffu
AGG / F Fund:...
F Nothing new here.. still in decline, stay away
SPX / C Fund:...
So far, FIBS has worked, Slow STO has started to turn up, MACD has not caught up yet, but I think it will. It looks like price has bounced off support from early march. I think its time to get back into C or S funds.
DWCPF / S Fund:...
S, Same as C Fund,
EFA / I Fund:...
I dont know how to read this one.. There are gaps in early and mid March which could act as support now, I dont think I would get into I Fund now, It has not gained much in the past 2 month overall.
Past 5 days returns..
F Fund... -1.14%
C Fund... 1.15%
S Fund... 2.41%
I Fund.... -0.56%
Other Charts....
DOW Index , CNBC Pre-Markets
My Magic 8 ball says S fund is the place to be for the next week or so.
Snaffu
Just because I give you advice, It doesn't mean I know more than you, It just means I've done more stupid stuff.
Re: TSP Forecast Apr
“The genius of investing is recognizing the direction of the trend – not catching the highs or the lows.”
- Dean Witter
"Put all your eggs in one basket and then watch that basket."
- Andrew Carnegie
- Dean Witter
"Put all your eggs in one basket and then watch that basket."
- Andrew Carnegie
Fund Prices2024-04-17
| Fund | Price | Day | YTD |
| G | $18.19 | 0.01% | 1.25% |
| F | $18.68 | 0.50% | -2.85% |
| C | $78.62 | -0.58% | 5.72% |
| S | $76.27 | -0.89% | -1.07% |
| I | $40.66 | -0.17% | 1.19% |
| L2065 | $15.60 | -0.47% | 3.17% |
| L2060 | $15.60 | -0.47% | 3.18% |
| L2055 | $15.60 | -0.47% | 3.18% |
| L2050 | $31.39 | -0.35% | 2.57% |
| L2045 | $14.34 | -0.33% | 2.47% |
| L2040 | $52.43 | -0.31% | 2.41% |
| L2035 | $13.87 | -0.28% | 2.31% |
| L2030 | $46.25 | -0.25% | 2.24% |
| L2025 | $12.93 | -0.12% | 1.78% |
| Linc | $25.29 | -0.09% | 1.55% |